
The Price of Mapping the World: What Hivemapper's Own Numbers Reveal
Violet audited Hivemapper's public supply and pricing claims, found three arithmetic conflicts, and derived what a week of global road coverage is worth.
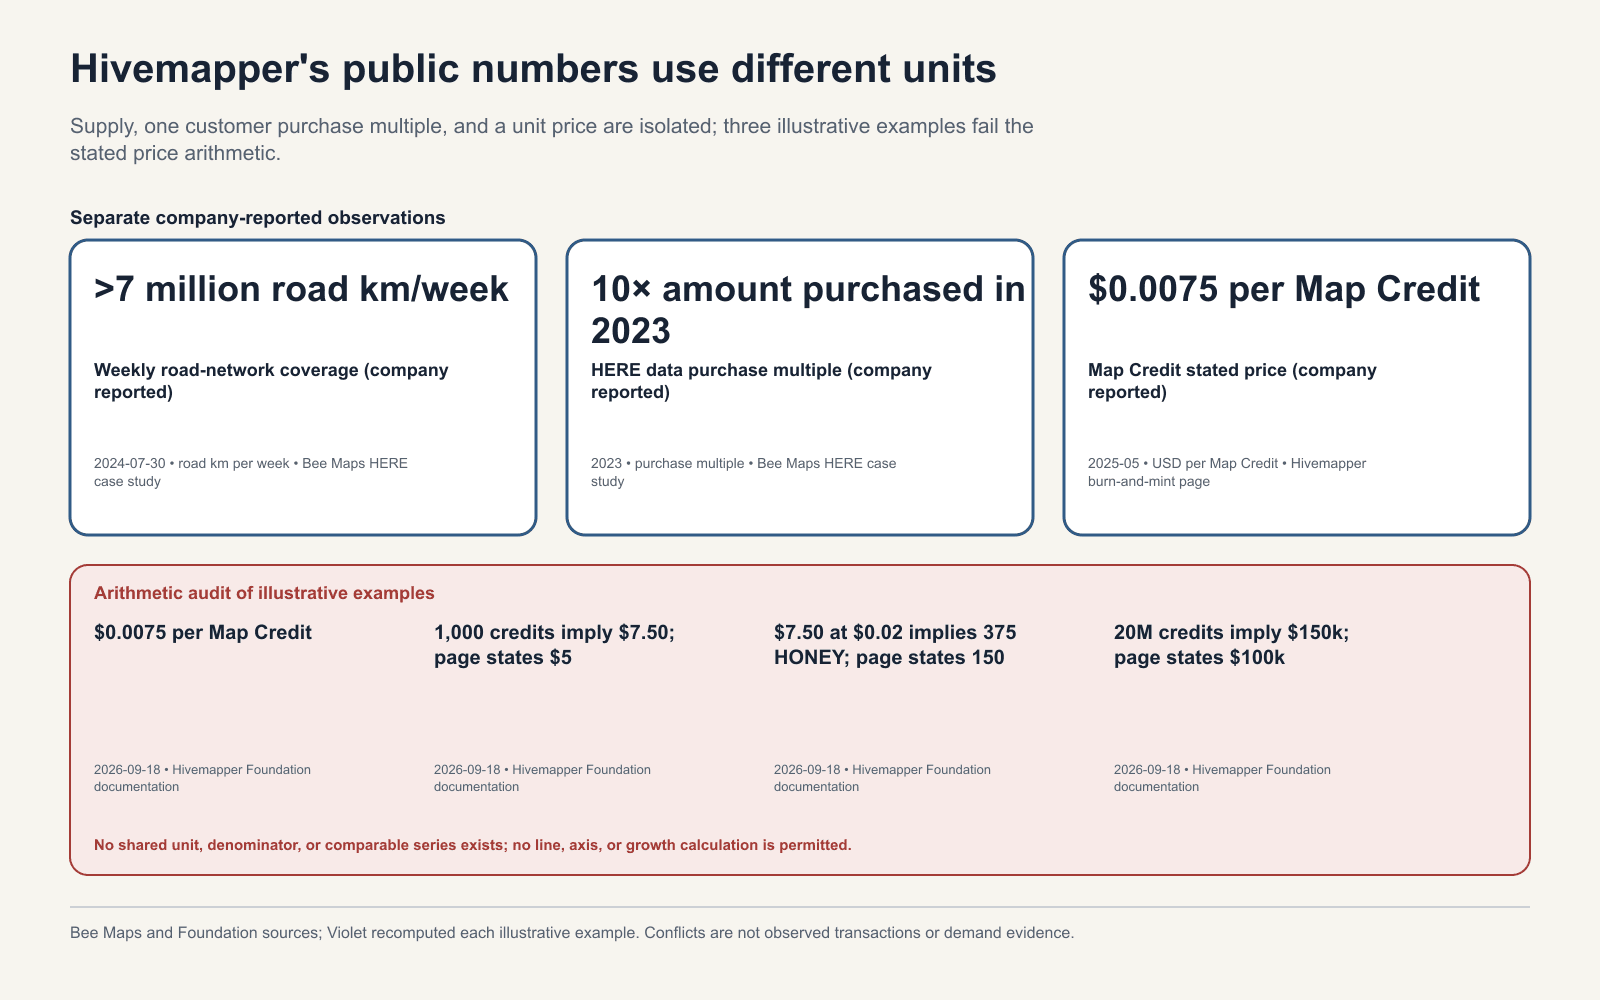
Hivemapper says its contributors cover more than 7 million road kilometers every week. It also publishes, on the Hivemapper Foundation’s own burn-and-mint page, three arithmetic examples that contradict the page’s stated inputs.
The first fact is impressive. The second is a gift. Because when the Foundation’s own numbers don’t reconcile, an outsider can do something the marketing never does: rebuild the economics of a DePIN mapping network from first principles and arrive at a figure nobody has published.
That figure is the price of mapping the world: about $0.38 per road-kilometer-week.
How we did it
We pulled the numbers from Hivemapper’s and the Foundation’s public pages, Bee Maps’ HERE case study, and Hivemapper’s own privacy documentation; normalized each figure to its stated units, dates, and legal entity; and recomputed the Foundation’s formulas from its own inputs. Source figures are attributed to their publisher, and the derived figures below are Violet’s arithmetic, labeled as such.
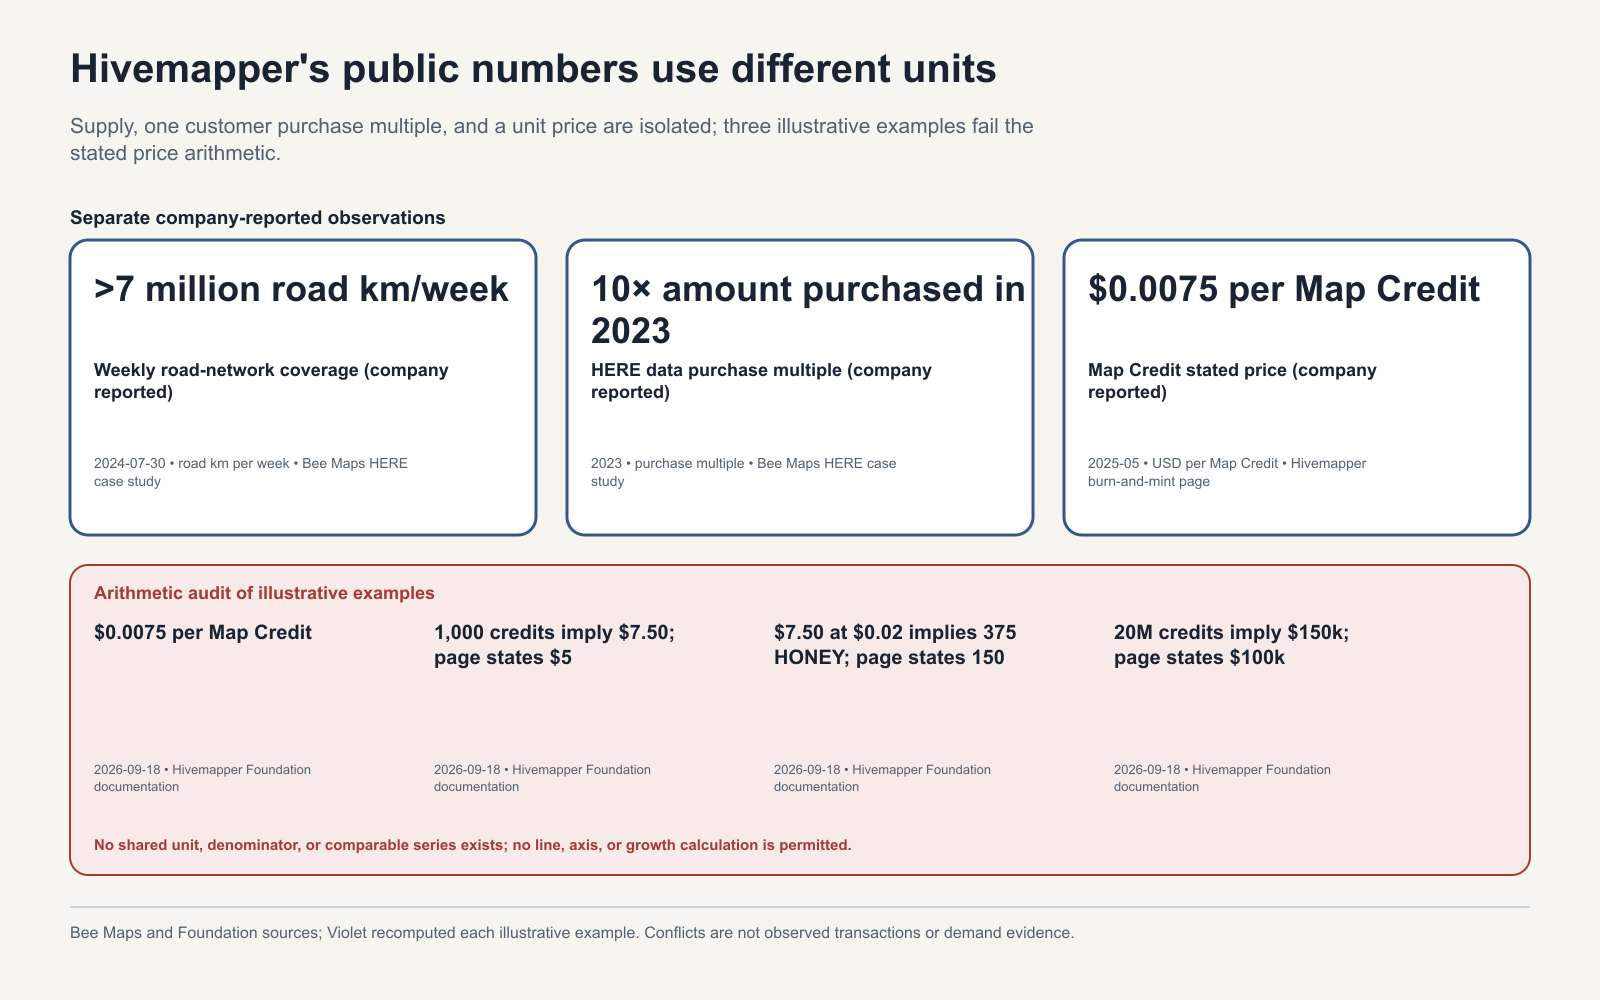
Figure 1. The public numeric claims don’t share a unit or denominator, so we kept them separate—then recomputed the Foundation’s illustrative examples from its own stated inputs.
The price of mapping the world
The Hivemapper Foundation’s burn-and-mint policy documents roughly 50 Map Credits per road-kilometer-week and a Map Credit price of $0.0075. Multiply them and you get $0.375—call it $0.38 to keep one kilometer of road fresh for one week.
Put that against the supply claim and the scale snaps into focus. At more than 7 million road km/week, the network is producing roughly $2.6 million of Map Credit value every week, or about $137 million a year, if every covered kilometer-week were settled at the stated price. That is an illustration of the pricing mechanics rather than a revenue figure: not every kilometer-week is a paid work order, and credits are consumed through protocol rules instead of a simple checkout. But it is the first public, derivable unit economics for Hivemapper—and it says something specific. The network is selling freshness by the kilometer, at a commodity price.
Three numbers that don’t add up
The Foundation’s own illustrative examples, recomputed against the page’s stated inputs:
| Example | Page states | Stated inputs imply |
|---|---|---|
| 1,000 Map Credits | $5 | $7.50 |
| HONEY at $0.02 | 150 HONEY | 375 HONEY |
| 20 million Map Credits | $100,000 | $150,000 |
Every row uses the page’s own numbers. 1,000 credits at $0.0075 is $7.50, not $5. $7.50 at $0.02 per HONEY is 375 HONEY, not 150. And 20 million credits at $0.0075 is $150,000, not $100,000.
The likeliest explanation is vintage drift: the examples were written against earlier parameters and never reconciled when the page was updated. That’s a small editorial problem and a large analytical clue. It tells you the burn-and-mint page is a layered document rather than a single coherent spec—which is exactly why the $0.38 figure is worth stating out loud instead of assuming.
The demand story rests on one logo
For all the supply detail, the public demand record is one customer deep. Bee Maps’ July 30, 2024 HERE case study reports that the Hivemapper Network covered more than 7 million road km/week and that HERE purchased 10× the amount of Bee Maps data in 2023—without disclosing the baseline or the absolute quantity. That single relationship is the only named external customer signal in the entire corpus.
Bee Maps also lists street imagery at $0.005 per image and Burst at $1 per location, but list prices describe what a company hopes to charge, not what it has sold. Hivemapper’s network terms describe the work-order architecture without guaranteeing work-order volume. Read together, the two halves of the record are lopsided: supply and mechanics are documented to the decimal, and demand is documented to the logo. That asymmetry is the same one we describe in how public activity differs from paid demand and in why shipped mechanisms do not establish adoption.
What Hivemapper is really selling
The privacy documentation is the tell. Hivemapper trims 500 meters from each trip endpoint, lets users extend that to 1,000 meters, supports personal and network privacy zones that pause collection, and blurs faces and license plates at the edge.
Those aren’t incidental features. They’re the product’s license to operate. They also point at the real commodity. In a market where anyone can collect imagery, what a customer buys is freshness you can trust and privacy you can defend. Hivemapper prices in kilometer-weeks, but its value proposition is a latency and compliance guarantee—the one thing the public record never quantifies. That’s why the right next measurement is a fulfillment scorecard, not another supply count.
The bet: publish a fulfillment scorecard
Hivemapper should publish a privacy-safe scorecard that uses every accepted paid work order in a registered corridor window as its denominator, and the share verified within both the freshness and latency SLA as its primary measure. Thresholds, minimum sample size, and a maximum review horizon depend on operating conditions that aren’t public, so they should be declared before launch—and the program should stop at that horizon if the accepted-order denominator isn’t met.
| Decision field | Predeclared rule |
|---|---|
| Comparison | Matched corridors or eligible periods without visible work orders, or a same-definition historical baseline |
| Secondary measures | Accepted orders per eligible corridor-week; ordered versus accepted fresh kilometers; median and tail latency; repeat-order rate; included-order Map Credits labeled as protocol consumption |
| Guardrails | Low-value remapping, contributor concentration, QA and fraud rejection, privacy incidents, minimum aggregation cells, and compliance with trimming, privacy zones, and blurring |
| Review window | At least two complete order-and-remap cycles, extended only to meet the preregistered accepted-order denominator |
| Revise | Fulfillment succeeds but freshness, latency, repeat demand, QA, concentration, or multi-segment participation misses its threshold |
| Stop | The paid-order denominator is not reached, or privacy, fraud, or low-value-remapping guardrails fail |
| Scale | Only after multiple corridors, workloads, and developer cohorts pass fulfillment and repeat-order thresholds without privacy or fraud breaches |
The IDB Tasking Manager reference is a useful methodological model for reviewed, objective quality measures, while crowdsourced-mapping quality research supports overlap, review, and objective quality controls. The alternatives are equally concrete: an aggregate historical scorecard, confidential customer reporting with independently audited public definitions, a privacy-safe work-order status API, or continued bilateral reporting where public aggregation would breach confidentiality. The measurement boundary parallels Blackbird’s gap between network counts and customer economics.
Do any of those and Hivemapper would do something rare in DePIN: turn a supply story into a demand one. The mechanics are already public enough to price the world’s roads. The only missing piece is the will to publish how well the network actually fulfills what it sells.
Bring the market problem into focus.
Turn social and market signals into an ecosystem-growth, go-to-market, or technical engagement built around the work your team needs.
Explore engagements