
Blackbird's Four Restaurant Counts—and the Number It Never Published
Violet compared Blackbird's four public restaurant states, reconstructed the reward economy behind 128.5 million FLY, and explains why counts aren't contribution.
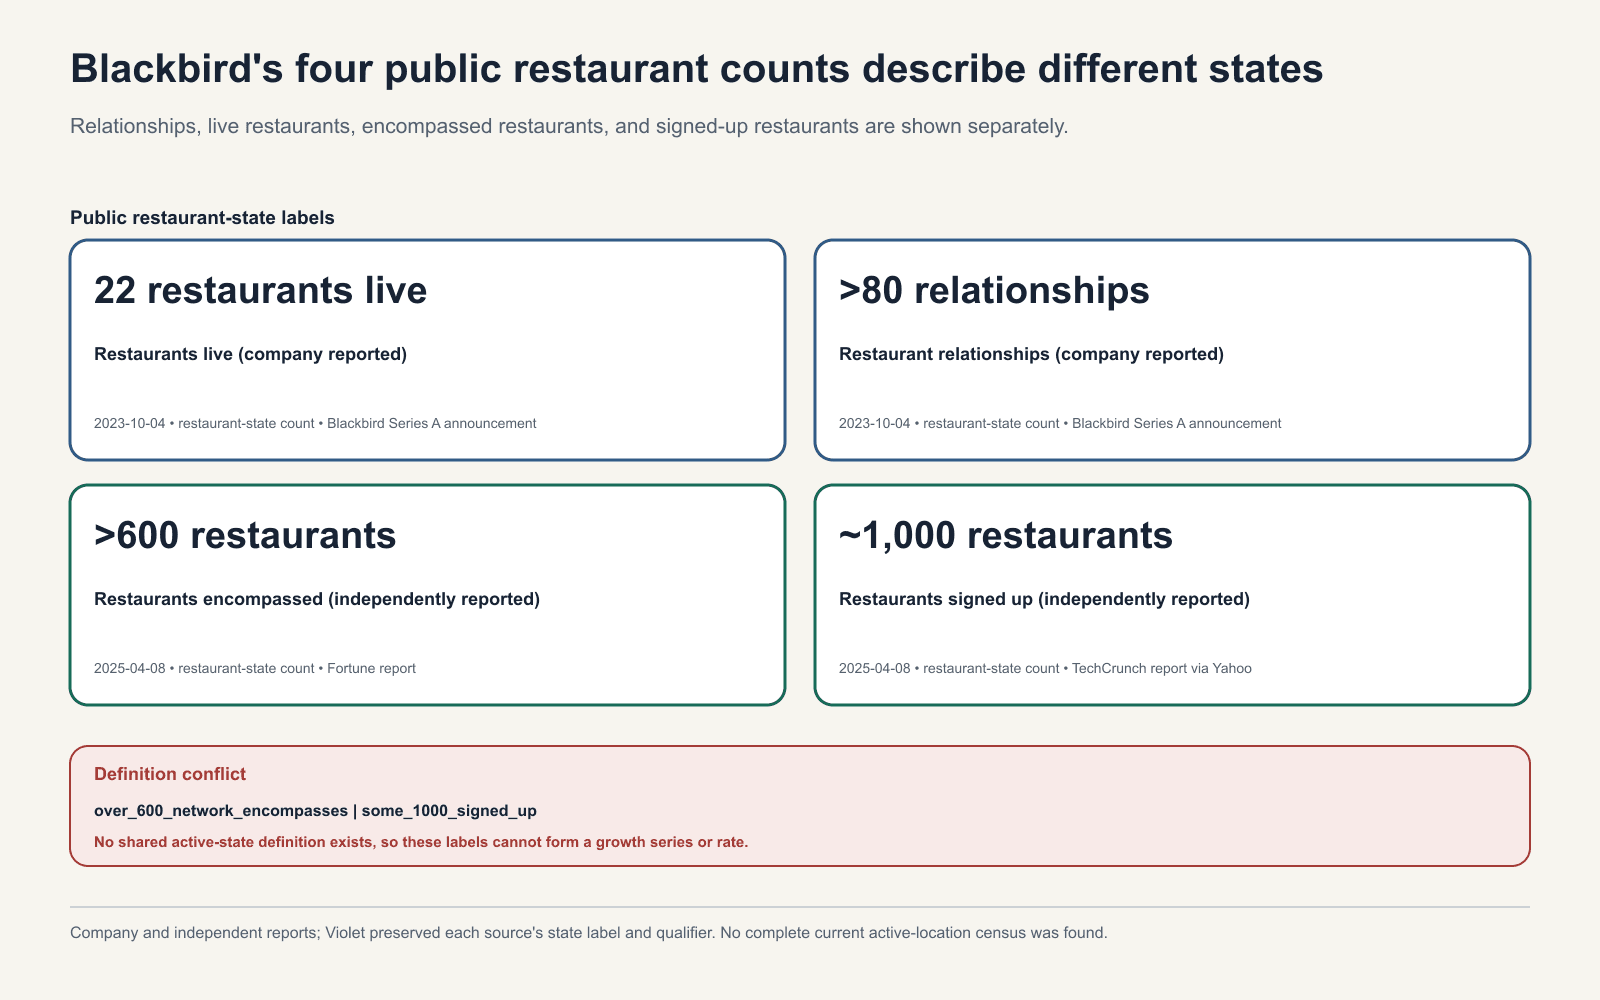
Blackbird has told the public four different numbers for how many restaurants are on its network. In October 2023 it reported 22 restaurants live and more than 80 relationships. In April 2025, separate reports described more than 600 restaurants “encompassed” and about 1,000 “signed up”.
Those aren’t four points on a growth curve. They’re four different states of a restaurant’s life on the platform—and the distance between them, especially between signed up and live, is the most interesting number in the dataset. It’s also the one Blackbird has never published.
How we did it
We pulled Blackbird’s financing announcement, the April 2025 coverage from Fortune and TechCrunch, the Blackbird Flypaper, the Google Play listing, and TIME’s operator reporting; normalized the four restaurant-state definitions; and reconstructed the reward economy from the Flypaper’s own labels. Source figures are attributed, and derived figures are Violet’s arithmetic.
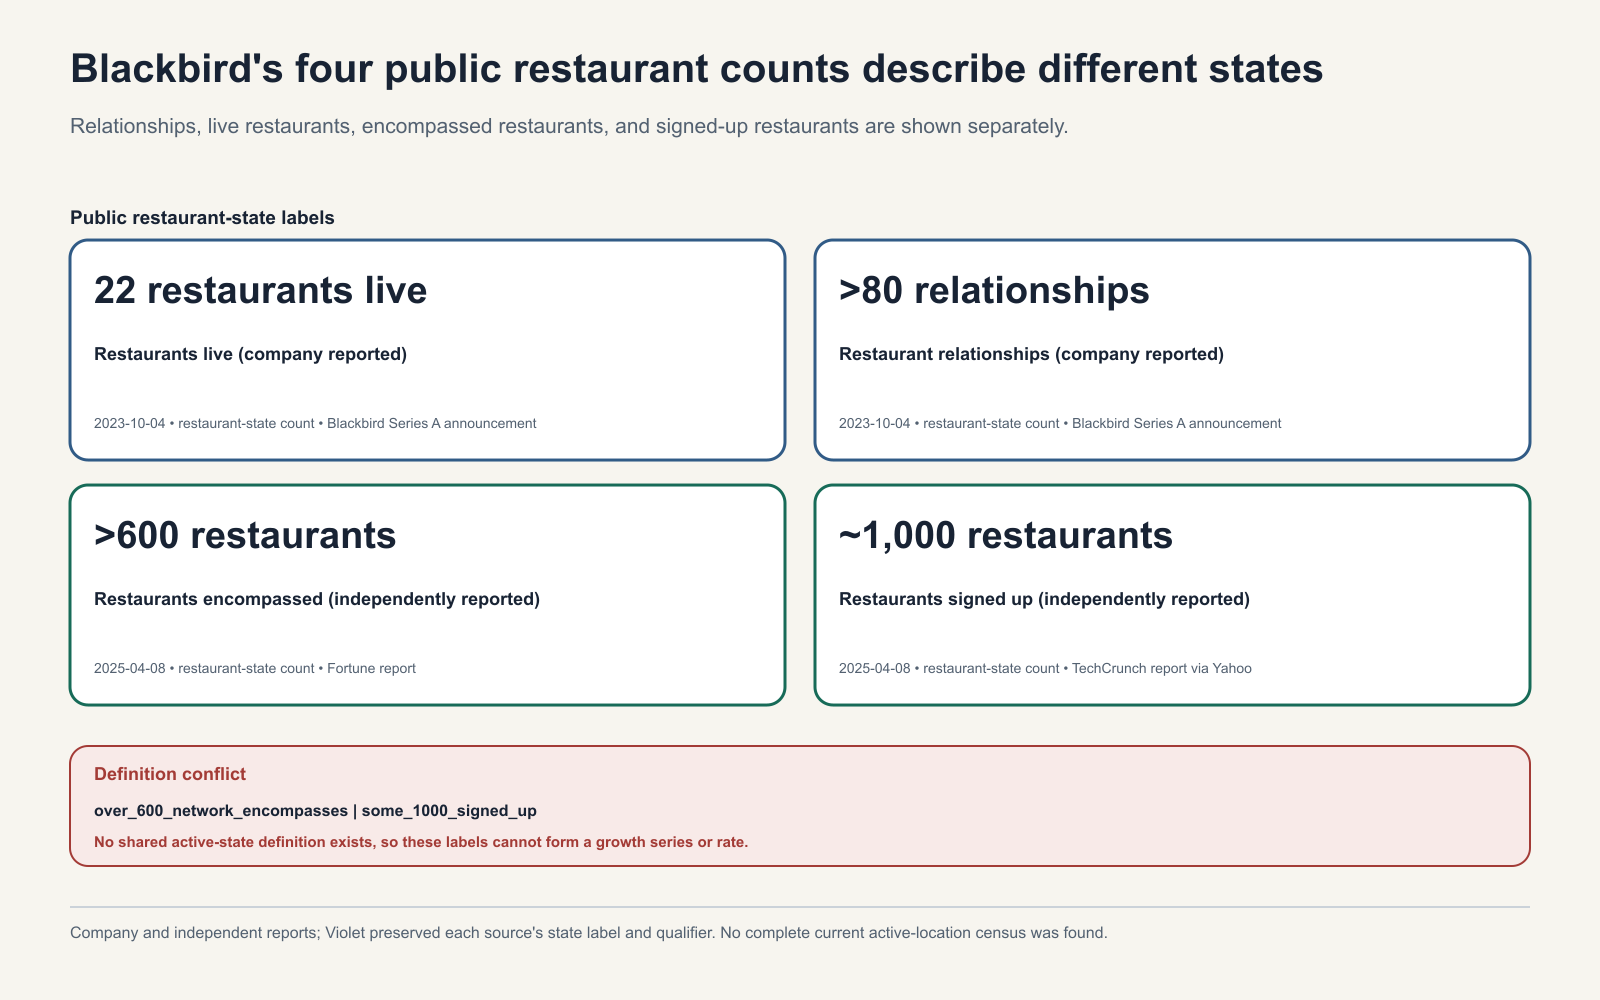
Figure 1. Four numbers, four definitions. Relationships, live restaurants, encompassed restaurants, and signed-up restaurants describe different stages of a restaurant’s life on Blackbird.
Four numbers, four different things
The four states come from three sources. Blackbird’s October 2023 financing announcement reported more than 80 restaurant relationships and 22 restaurants already live. On April 8, 2025, Fortune reported more than 600 restaurants encompassed, while TechCrunch reported about 1,000 restaurants signed up.
A restaurant that signs up, gets encompassed by a partnership, and goes live is three different milestones. Blurring them is how a count becomes a story. Relationships, live, encompassed, and signed up share no common denominator, so they can’t be subtracted, ordered, or turned into a growth rate—and any headline that merges them is doing marketing arithmetic, not measurement. Our broader work on why source-native states need compatible definitions makes the same point.
The funnel hiding in plain sight
Here’s the useful part. If roughly 1,000 restaurants signed up and only a fraction ever go live, Blackbird’s real network is much smaller than the headline. If “encompassed” is effectively live-equivalent, it’s much larger. The public record can’t tell you which—but the shape of the funnel is the single most valuable disclosure Blackbird could make.
Consider what the four numbers imply when read as a sequence rather than a series. In 2023, 22 restaurants were live against more than 80 relationships—a live-to-relationship ratio under 30%. By 2025, the company was describing 600+ encompassed and ~1,000 signed up, but published no live figure at all. The most natural explanation is that “signed up” is a top-of-funnel count and “live” is the conversion that actually matters. Publishing that conversion rate would settle the question in a single line. Not publishing it leaves the network’s true size as the interesting unknown.
What 128.5 million FLY can tell us
The Blackbird Flypaper publishes three labels: a 590 average FLY reward, 2.8k FLY per wallet, and 128.5 million FLY distributed. The paper doesn’t define the windows or populations behind them, but the labels still support a reconstruction.
If 2.8k FLY per wallet is the right denominator, then 128.5 million FLY distributed implies roughly 46,000 wallets. If 590 is the average reward, the same total implies roughly 218,000 rewards issued—about 4.7 rewards per wallet. Those are Violet’s derived estimates under the paper’s own labels, not disclosed figures, but they describe a coherent reward economy: a relatively small wallet base transacting a handful of times each.
That ratio is the number to watch. A loyalty currency that issues hundreds of thousands of rewards across tens of thousands of wallets is working at the level of frequency. Wallets aren’t diners and FLY isn’t revenue—but 4.7 rewards per wallet is a testable behavioral signature, and it’s the kind of number that separates a rewards program from a rewards habit. Our analysis of why a shipped product surface isn’t adoption draws the same line.
Loyalty is an incrementality problem, not a count problem
Counts, wallets, downloads, and app ratings all measure activity. None of them answers the only question a restaurant actually cares about: did the program make a restaurant more money than it would have made without it?
That’s an incrementality question, and it’s answerable. Restaurant-setting interventions can be randomized, as an American Economic Review field experiment demonstrates, and a Marketing Science promotion experiment shows how to structure holdouts, intent-to-treat measurement, and cost-complete evaluation. The same methodological point shows up in Courtyard’s conflicting public scale labels: headline scale can motivate a hypothesis, but it can’t substitute for a defined outcome.
The bet: a restaurant-level incrementality test
Blackbird should run a preregistered restaurant-level randomized test—or a defensible matched comparison when randomization isn’t feasible—and measure incremental restaurant contribution after rewards, discounts, payment costs, and program costs. This is Violet’s recommendation, not an observed company plan.
| Design field | Preregistered decision rule |
|---|---|
| Hypothesis | A defined acquisition or repeat-visit treatment creates positive incremental restaurant contribution after rewards, payment costs, discounts, and program costs. |
| Unit and denominator | Every eligible assigned restaurant or restaurant-period in the preregistered population. |
| Comparison | Eligible holdout restaurants, or preregistered matched restaurant-periods when randomization is infeasible. |
| Primary measure | Incremental restaurant contribution after reward, payment, discount, and program costs. |
| Secondary measures | Verified incremental visits; new-to-restaurant diner rate; repeat-visit rate within the review window. |
| Required inputs | Eligibility and assignment; pre-period visits and contribution; exposure and verified visits; contribution after discounts and fees; rewards, refunds, disputes, and complaints. |
| Guardrails | Restaurant operating burden; reward cost per incremental visit; refunds and disputes; diner complaints; cannibalization, privacy, and spillovers. |
| Review window | A power-driven sample spanning complete local demand cycles plus the preregistered repeat-visit window. |
| Revise | Visits rise without net contribution; effects depend on one segment; assignment balance fails; or spillovers compromise comparison. |
| Stop | Net contribution crosses the negative boundary or material restaurant or diner guardrails deteriorate. |
| Scale | Only after net contribution clears the preregistered minimum and replicates across at least two markets and multiple restaurant segments. |
| Alternatives | Test restaurant-quality selection, reward design, or payment-route effects; use matched periods only when randomization is infeasible. |
A program that can show incremental contribution has a business. A program that can only show counts has a press release. Blackbird already publishes the counts. The incrementality test is the one that would tell the restaurants—and everyone else—whether the network is actually worth it.
Bring the market problem into focus.
Turn social and market signals into an ecosystem-growth, go-to-market, or technical engagement built around the work your team needs.
Explore engagements